Sunday, April 30, 2017

4/18 Passive RC Circuit Natural Response

         The purpose of this lab is to build the actual RC circuit circuit. Then find the nature frequency and outout voltage.
1. Provide the initial capacitor voltages and time constants for the circuits


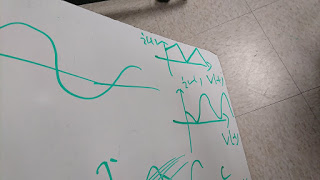
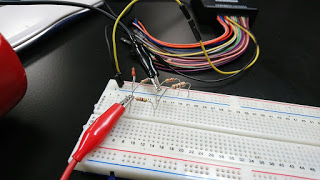
2. Provide below a schematic of the circuit you implemented, including actual resistance and capacitance values used in your circuit. A picture of your whiteboard sketch is adequate.
This is the actual circuit we built during the experiment:
The actual resistance for R1 = 0.977 ohms and R2 = 2.16k ohms.

3. Attach an image of the oscilloscope window,showing the capacitor voltage response for the circuit of Figure2(a)
from the graph we measured 5 time constant = 0.343s
And from the pre-lan we calculated 5 time constant = 0.352s
% error = (0.352-0.343)/0.343*100% = 2.56%

Figure 2(b)

From the graph we measured 5 time constant = 0.08158s
From the pre-lab we calculated 5 time constant = 0.0756s
% error = (0.08158-0.0756)/0.08158*100% = 7.91%


Summary 
     In today's class, we were learning how to find the equivalent for the capacitor and inductor. For the inductor, it is the same as the resistance when inductors are in parallel and series. However, the capacitor is in the inverse. Also, we learned two equations for the inductor and capacitor:

The follow photo is the example we did during the class: 


4/13 Capacity Voltage-current Relations

         The purpose of this lab is to verify the voltage function of capacity. We need to use the analogy to find the actual voltage function VS time. Then compare our graph on the whit board.

1. Attach the sketched of the vapacitor voltage and current for both sinusoidal and triangular inputs

2. Attach an image of the oscilloscope window, showing the capacitor voltage and current waveforms and the measured amplitudes of the waveforms for a 1K HZ sinusoidal input.


The picture is when applying a sinusoidal input voltage with frequency = 1kHz, amplitude = 2V, and offset = 0V to the circuit.

3. Attach an image of the oscilloscope window, showing the capacitor voltage and current waveforms and the measured amplitudes of the waveforms for a 2K HZ sinusoidal input.


4. Attach an image of the oscilloscope window, showing the capacitor voltage and current waveforms and the measured amolitudes of the waveforms for a 100Hz triangular input.


Summary
       During the class we learned the basic concept of capacitor. We treat a capacitor as open circuit in the beginning because there is no current there.
 these are some examples we did in the class.

4/11 Temperature Measurement System Design

       The purpose of this lab is observe the resistance change of Thermistor as the temperature changes. Then plot the graph Temperature VS voltage.

1. Thermistor Characterization provide the measured sensor resistance variation over the specified temperature range.

2. Wheatstone Bridge Design
    a. sketch the circuit to convert resistance variation to voltage variation. Include desired and actual values for circuit components

    b. Provide the measured output voltage for nominal temperature
       

    c. Provide the measured range of output voltage over specified temperature range.

        We can find them from the video above.

3. Difference Amplifier Design
     a. Provide a sketch of difference amplifier circuit, including desired and actual values for circuit components


Summary
            In today's class, we learned the concept of amp circuit and how to replace a the amp circuit with resistance. Then, we did some examples of how to deal with the amp circuit.


Saturday, April 29, 2017

4/6 Difference Amplifier

    The purpose of this lab is to verify the function of difference amplifier. We need to meaure the input and output voltage to see if they match the equation we used in the pre-lab

1. Provide the relationship between the input and output voltages that you determined in the pre-lab. Why is the circuit is called a difference amplifier?

2. Provide a schematic of the circuit you implemented, including actual resistance values used in your circuit.
The actual value of resistance we used in this lab is: 
R1 = 9.94K, R2 = 19.9K, R3 = 9.98K, R4 = 19.7K

3.Attach a table of output and input voltages for your circuit. Also attach a plot of the output vs. input voltages.

4.Provide a brief discussion of your results and a comparison between measured and expected circuit response. Include any observations you made relative to saturation of the output.

According to our experimental data, the equation 
matched our experimental data which means that this equation is true. However, the maximum and minimum output voltage cannot reach 5V because of saturaty.


Summary 
        The same as summing amplifier because we learned them in the same day.

4/6 Summing Amperifier

      The purpose of this lab is to observe the function of summing amplifier. We need to measure the value of input and output voltage. Then compare these two values to see the unique function of summing amplifier.


1. Pre-lab: design an inverting summing circuit:

This  picture is the calculation we did based on the graph from the Lab manual. According to our calculation, the maximum Vout = (-R3/R1)(Va+Vb).

2.
This is the actual circuit we build during the experiment.
actual resistance of R1=6.71k
                             R2=6.67k 
                             R3=6.73k

3. The actual value of output voltage is 
\
we found that the maximum and minimum Vo is 3.44 and -3.44V because of saturate.

Summary
       In today's class, we learned the concept of amplifier. There are four different types of amplifier: 1. summing amplifier, 2. difference amplifier, 3. inverting amplifier and 4. non-inverting amplifier.
These are the formulas for the amplifier: 


And this is the example we did in the class: 


Sunday, April 16, 2017

4/4 inverting Voltage Amplifier

    The purpose of this lab is to verify the function of inverting voltage amplifier. The inverting voltage amplifier will change the sign of input voltage. If the input voltage is positive, then the output voltage will be negative.

1. Provide a schematic of the circuit you designed, including actual resistance values used in your circuit.
This is the circuit we designed for this lab. The actual resistors we used in this lab are 2.2K and 4.7K

2. Attach a table of output and input voltages for your circuit. Also attach a plot of the output vs. input voltage.


3. Provide a brief discussion on your results and a comparison between measured and expected circuit gain. 
The relationship between Vout and Vin is Vout = -(R2/R1)*Vin

which is agree with our graph table.

Summary 
       In today's class, we learned the concept of inverting and non- inverting amplifier. The invert amplifier will change the sign of output voltage with the input voltage. However, the non-inverting will not change the sign of output voltage.

3/28 Thevenin's Theorem

        The purpose of this lab is to verify the equation of finding the Thevenin's resistance. First, we need to calculate the Thevenin's resistance in the pre-lab. Then replace the entire circuit with the Thevenin's resistance to see if the voltage or current changes.

1. Sketch of the Thevenin equivalent circuit you determined in the pre-lab. Label the Thevenin resistance and the open-circuit voltage on you sketch:


2.A schematic of the circuit you implemented in the lab procedure. Label he schematic with the actual resistance values used.

actual resistance(inside the parenthese):
1k(0.96k), 2.2k(2.15k), 4.7k(4.6k), 6.8k(6.68k), 1.8k(1.74k), 6.8k(6.68k)

This is the set up of our experiment.


3. Provide your measured values for the Thevenin resistance and the open-circuit voltage from part 2 of the lab procedures. Also provide the percent error between your measured values and your expectations from the pre-lab analysis.
Thevenin Resistance:

percent error: (7.7K-7.4k)/7.7K*100% = 3.9%


Thevenin Voltage:

4. In the space below, provide your result from part 3 from the lab assignment, including:

a. value of load resistor: 7.7K
b. the measured load resistor voltage: 0.167 V
c. expect value of load voltage: 0.165 V 
percent error = (0.167-0.165)/0.165 * 100%1.21%

5. Your plot of power vs. load resistance generated in part 5 of the lab procedures. Provide your estimate(from the data) of the load resistance which draws maximum power from the circuit.
maximum power occurs when Rl = 8.5K

Summary
         In today's class, we learned how to use the Everycircuit. The Everycircuit is very convenient because we can build all the circuit use it. Then, we learned how to find the Thevenin Resistance and voltage.  

3/23 Superposition II

          The purpose of this lab is to verify the analogy method: superposition using the experimental way. We first need to calculate the voltage and current using the superposition. Then find the actual voltage and current. Compare them to find the percent error.


Here is the photo of our experiment: 


According to our calculation, the experimental value of voltage across the 6.8K resistor should be1.99V.

Procedure of this Lab:
1. Turn off all independent sources except one source. Find the output (voltage or current) due to that active source using nodal or mesh analysis.
2. Repeat step 1 for each of the other independent sources.
3. Find the total contribution by adding algebraically all the contributions due to the independent sources.

Set up of our experiment:

Voltage across 6.8K resistor when voltage source is 5V:

Voltage across 6.8 resistor when voltage source is 3V:

This is our result table:

Summary
        In today's class, we learned the superposition. The definition of superposition is that:  The superposition theorem for electrical circuits states that for a linear system the response (voltage or current) in any branch of a bilateral linear circuit having more than one independent source equals the algebraic sum of the responses caused by each independent source acting alone, where all the other independent sources are replaced by their internal impedances.

Monday, April 3, 2017

3/21 Mesh Analysis

          The purpose of this lab is to verify the mesh analysis. First of all, we need to calculate the theoretical value of current and voltage for the circuit. Then, use the experimental method to find the actual value and compare to find the percent error.

1.In the space below, provide a schematic of the circuit, labeled with meshes and values for mesh currents as determined in the pre-lab. Provide estimates for the voltage V1 and current I1, based on your mesh currents.

2. In the space below, provide a schematic of the circuit being testing, including measured resistance values.
3. Provide your measured values for the voltages V1 and current I1. Provide a percent error between the measured and expected values. Comment on any significant differences between the measured and expected values.

percent error for V1 = (5-4.98)/5 *100% = 0.4%
percent error for I1 = (0.3224-0.321)/0.321*100% = 0.44%

Summary
       In today's class, we learned how to do the mesh analysis. It is much more convenient compare to the node analysis. We have to know how many loop in the circuit; then, find the resistance and voltage in each loop and use the formula directly.