The purpose of this lab is to find the apparent power and the power factor through the experiment method. Then compare the theoretical value and the experimental value to see the percent error.
1. Pre-Lab calculation:
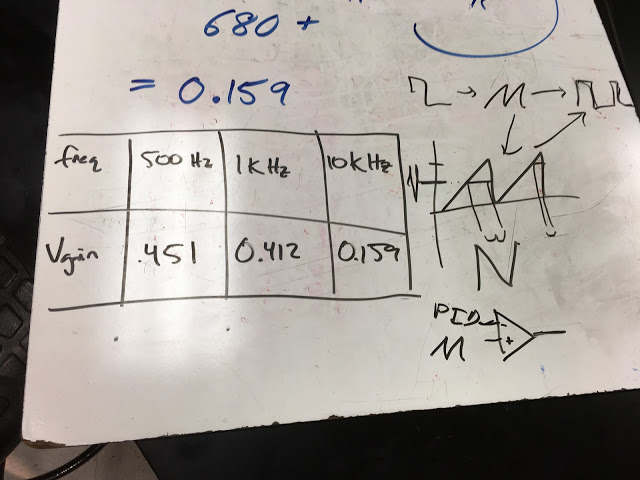
And this is the final calculation result:
This is the actual set up of our lab:
Following are the result of our lab:
Load resistance = 10 ohms
The RMS value of load voltage is 627mV.
The RMS value of load current is 18.7mA.
The phase difference is 64.44 degree.
Load Resistance = 47 ohms
The RMS value of load voltage is 625.1mV.
The RMS value of load current is 10.68mA.
The phase difference is 36.83 degree.
Load Resistance = 100 ohms
The RMS value of load voltage is 660.1mV.
The RMS value of load current is 6.22mA.
The phase difference is 12.6 degree.
Summary
In today's class, we further learned how to calculate the apparent power and power factor. Also, we discussed when will the power of load resistance reach the maximum. The following picture are some formulas that can help us better understand power: